
Price History: Why Knowing What Something Cost Last Month Matters More Than the Tag Today

Key Takeaways
Price History
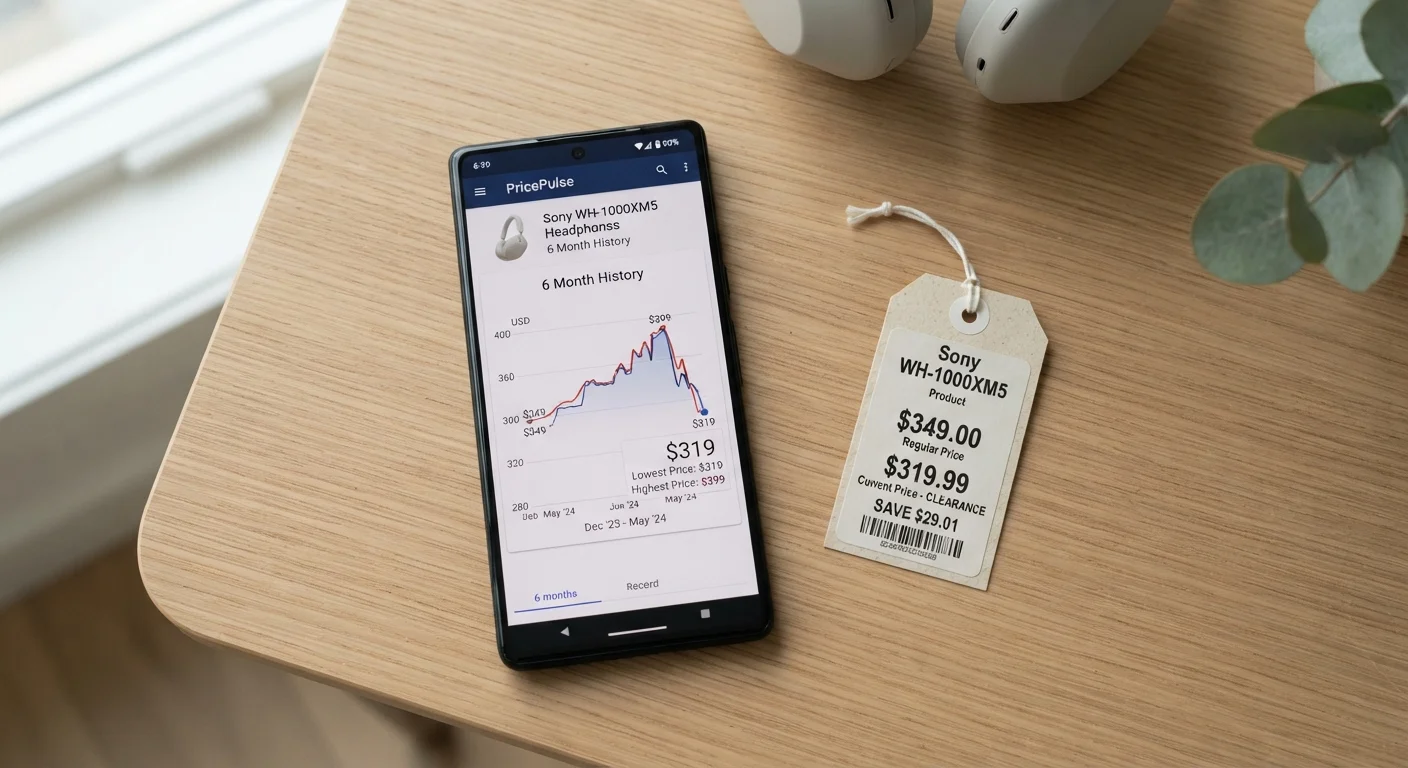
Price history is a record of how much a product has been listed or sold for over a period of time - days, weeks, or months. It shows whether a current price is genuinely lower than usual, higher than normal, or simply unchanged behind a new promotional label. Tracking this context is what separates a real discount from a marketing illusion.
Retailers may inflate a reference price before a sale to manufacture the appearance of a larger discount - a practice sometimes called "reference price inflation" or "price anchoring." Price history data exposes this by showing the product's actual price trajectory.
The Problem With Only Looking at the Tag
A price tag answers one question: what does this cost right now? It says nothing about whether that number is low, high, or artificially inflated for the sake of a promotional event. Without historical context, you're evaluating a single data point in isolation - which is exactly the condition retailers benefit from most.
Consider the mechanics: a retailer lists a blender at $120 for several months, raises it to $150 two weeks before a sale, then promotes it at "30% off" for $105. The tag shows a discount. The price history shows a product that was available for less - without any sale - throughout the prior season. Without that record, the deal looks real. With it, the actual savings become clear.
This isn't a fringe tactic. Investigations by consumer advocacy organizations and journalists have documented reference price inflation across major retail categories, particularly around high-traffic sale events. Understanding price history is one of the most direct defenses against it. See our breakdown of real versus manufactured discounts for more on how these tactics operate.
What Price History Actually Tells You
A price history chart does several things a current price cannot. It shows:
- The price floor: the lowest the item has been priced in the tracked window. This is your benchmark for a genuine deal.
- Price volatility: whether this product swings frequently or holds steady. High volatility means waiting may pay off; a flat line suggests the current price is likely the norm.
- Timing patterns: whether prices drop predictably around certain periods - post-holiday clearance, back-to-school windows, model-year transitions.
- Promotional inflation: visible spikes just before a sale event, which often confirm that the "original" price used to calculate a discount was artificially elevated.
This information directly supports the kind of researcher mindset that separates informed buyers from reactive ones. The goal isn't to never pay full price - it's to know when you are and decide deliberately.
~22%
Average pre-sale price inflation documented in some categories
Research published by consumer advocacy groups has found that reference prices used to calculate discounts are sometimes inflated by roughly 15-25% before major sale events, though figures vary by retailer and category.
3-6 months
Recommended price history window for most purchases
Consumer researchers generally suggest reviewing at least 90 days of price data for standard goods; seasonal items benefit from a full 12-month view.
20-40%
Typical seasonal price range for common retail categories
Categories such as outdoor furniture, winter apparel, and consumer electronics can legitimately vary in price by this margin across a calendar year based on seasonal demand cycles.
How to Build a Price History Habit
You don't need a spreadsheet or dedicated software to use price history effectively. The practical workflow is simpler than most people expect.
For online purchases: Free browser extensions designed for major e-commerce platforms can display a product's price chart directly on the listing page. They typically show 30, 90, or 180-day histories and flag whether the current price is near a historical high or low. Install one before your next significant purchase and consult it as a standard step - the same way you might check reviews.
For in-store purchases: Price history is harder to access but not impossible. Many retailers with both physical and online presences list their prices online, making historical tracking feasible via the same tools. For large categories where seasonal pricing patterns are well-established - such as appliances, mattresses, and outdoor goods - general awareness of the calendar cycle is itself a form of price history knowledge.
Know what to ignore: Price history is most useful for standardized, widely sold products. For custom items, limited-run goods, or categories with highly variable configurations, the data may be sparse or misleading. Apply the tool where it works and recognize its limits elsewhere.
Check Price History Before High-Value Purchases
Make price history lookup a standard step for any purchase above a threshold you set - say, $50 or $100. It takes under two minutes with a browser extension and can reveal whether a promoted price is genuinely low or simply dressed up as a bargain. The habit is easiest to build if you attach it to an existing step, such as reading product reviews.
When Price History Changes the Calculus
Armed with price history, the decision framework for a purchase shifts. Instead of asking "Is this a good deal?" - a question the retailer's framing is designed to answer for you - you ask: "Is this price lower than what I've seen it reach before, and is that gap meaningful enough to act on now?"
That reframe matters. It decouples your decision from urgency cues ("sale ends Sunday") and anchors it to objective data. If the price history shows the item has hit a lower point twice in the past year, waiting may make sense. If the current price matches or beats its historical floor, buying now is a genuinely informed choice - not a reaction to manufactured scarcity.
It's also worth noting that price history doesn't always argue for waiting. Some products follow a clear upward trend as supply tightens or demand grows. In those cases, the historical record is an argument for acting sooner. The data can support either conclusion - what it eliminates is the guesswork. For a broader look at how pricing strategy varies by retailer, understanding sale events versus everyday low pricing is a useful complement to this habit. And if you want to pressure-test common assumptions about when deals are real, our look at shopping myths that cost people money is worth a read.